

Now the blog year 2016 is over, and it's actually kind of fun to look at the statistics. When you put a lot of work into writing and photographing and blogging, it's fun to see if anyone is reading. And who is reading? And what? Maybe you can learn something along the way and become a little wiser for the coming year ...
 Tweet
Tweet Share
Share Share
Share Pin
Pin Share
Share Share
ShareInnehållsförteckning
Thank you to all readers!

Firstly, we have a group of loyal readers who check in here more or less regularly. We would like to start by saying a big THANK YOU to you: you are amazing! Many of you comment often and we appreciate your honest, funny and wise comments very much. This is what makes blogging so much fun!
In addition to these regular readers, we have a large number of visitors who drop in from time to time, or who stumble upon a post through a Google search. These readers are of course also important to us!
How many people find the blog?
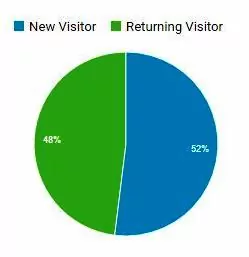
We have looked at the statistics for 1 January 2016 to 31 December 2016, and we see that a whole bunch of people have checked in. That's great! The pie chart shows that 48 % of the visitors are repeat visitors.
- Unique visitors: 149 864
- Page views: 577 274
Who are our visitors?
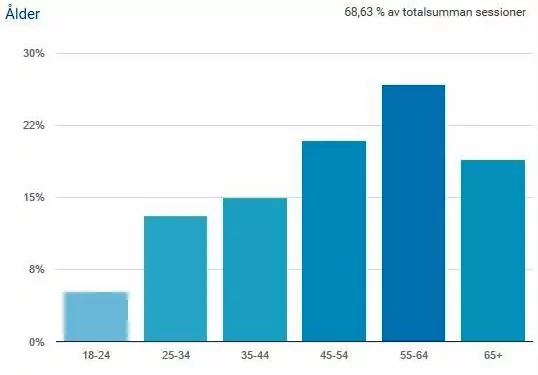
So who are the visitors to our blog? Well, according to Google Analytics we can see that the typical visitor is a woman between 55-64 years old living in Stockholm, or at least in Sweden. But we also have quite a few male readers! Do you recognise yourself in the statistics?
- queue: 62 % women and 38 % men
- Country): Sweden (82 %), Norway (4 %), Finland (2 %), Spain (2 %), USA (2 %), Portugal (1 %) and others.
- Location: Stockholm (22 %), Göteborg (6 %), Malmö (3 %), Helsingborg (2 %), Örebro (1 %), Lund (1 %) and others
- Age: See diagram below
How do visitors read?
According to all forecasts, it will become more and more common to read blogs (and other things) on mobile phones and tablets. We have worked a little during the year to get the blog more adapted for mobile phones, and it makes sense if you look at the statistics. How do you read our blog and how do you think it works?
- Unit: Computer (44 %), mobile phone (32 %), tablet (24 %).
What do visitors read most?
When you have a blog, it's always interesting to see what the most read posts are - and it's almost never what you think! For example, it's interesting that our most read blog post in 2016 is a post about food and prices in Portugal, which we wrote in January 2015...

Generally speaking, our most popular blog posts are about motorhomes, pitches, living in a houseboat, Croatia, Albania and other European destinations such as Portugal, Iceland, Budapest and Sardinia. Some "How to" posts are also popular, such as The art of eating a meal in Italy, Eating whole crab - how to and How to afford travelling. Here is the top list for 2016:
5 most read pages
5 most read blog posts
- Food, wine and prices in Portugal
- 10 nice campsites in Europe
- What is a reasonable price for a car park?
- The world's 5 most expensive motorhomes
- Water leak in the motorhome (and a lot of other faults)
So, what conclusions do we draw from this now? Well, I don't really know ... That we will continue to blog about caravanning, travelling and things that we think are fun? What do you want to read about on the blog? And you who have your own blog ... do you check your statistics sometimes to see who the readers are and what is most popular?

You might also like:


Lennart says:
Statistics are fun.
Especially when it is positive!
03 January 2017 - 6:34
Lena - gott för själen says:
Hehe, prices in Portugal. Yes, it was an unexpected peak to say the least.
Do I recognise myself in the statistics? Well, probably because I'm 50+, but I haven't reached 55 yet. And no, I don't live in Stockholm. I live in Enköping. Kind of almost Stockholm 🙂 . I read your blog both on computer and handset. Works well both.
Reading statistics goes in cycles for me. I am simply not very good at reading what is said, even if I understand the parameters you present here. Must try to get better at it.
Hug Lena
03 January 2017 - 7:14
Aila says:
What I like about your blog is that you write about so many different things.
Travel, hotels, motorhome, food, your lives, houseboat, etc. You never know what they will come. Great fun.
I think you should continue to do so.
Enjoy yourselves.
//Aila
03 January 2017 - 7:35
admin says:
Lennart, it's of course most fun when it's positive 😉 But it's also exciting to see what works and what doesn't and think about why!
Lena, I feel that I can never really predict what will be the top notes. It's usually NOT what I think, haha 😉 .
Aila, yes, we probably like to write about everything. There is a focus on travel and motorhome, but then it is fun to write about everything else that happens in everyday life! 🙂 Glad that it is appreciated!
03 January 2017 - 7:41
Ditte says:
I am a loyal follower and I recognise myself. I like the variety in your blog and appreciate the variety.
And it's interesting to see the statistics and which posts are more popular. Sometimes you get surprised. Very surprised!
I'm not a motorhome person, except that we rented a motorhome in New Zealand and a camper in the USA, but like many, I enjoyed your motorhome trip through Europe last year.
Of course, it will continue into 2017.
03 January 2017 - 7:57
LinizTravel says:
Interesting statistics!!! Under how to read age?! Have a wonderful day!!! Hugs
03 January 2017 - 8:22
admin says:
Ditte, a motorhome is just the way to travel. The destinations and experiences can be the same as when travelling in other ways!
Liniztravel, do you have Google Analytics? You set the time period you are interested in at the top and then all the parameters are in the left column. Age is under "demographics"
03 January 2017 - 8:45
Kenneth Risberg says:
Haha, would I be the 1 per cent from Örebro then?
I liked your European trip and find it interesting to read about motorhomes and travelling but also about all the other travel stuff you write about.
Good continuation!!!
03 January 2017 - 8:49
Åsa says:
Yes, there is a lot of interest in Portugal!
Wow, you're growing - I hope it pays off in all sorts of good ways, not "just" in visitor numbers! /Åsa
03 January 2017 - 8:50
Solan says:
Surprised by the top tier? That's the funny thing about statistics. The men's magazine Café's most read report was a vacuum cleaner test many years ago... I think you should go with your gut feeling. Do not adapt too much to statistics. You have a good mix Freedom 🙂
03 January 2017 - 8:55
OnTrip.dk says:
Congratulations on the great numbers your static shows. Good work?
03 January 2017 - 9:08
Geddfish says:
Note: where is Lidköping in the statistics 😀 Maybe it goes as a suburb of Gothenburg 😉.
I thought that Here is my life with Peter would stand out in the statistics, because I have read it with great pleasure and I think many others have as well.
Your FREEDOM blog is interesting and varied, so I make daily visits. I like to post a crow too and it's so nice to get an answer to it too!
Statistics are always fun, and you better believe I follow my own. It's amazing what people choose to read.
Good continuation 😀 .
03 January 2017 - 9:20
Åse says:
I like the variety here with you, that you don't know what you will find when you look in! I who live in Ystad have probably slipped outside the statistics ? Good continuation of 2017
03 January 2017 - 9:22
admin says:
Kenneth Risberg, nice to hear from Örebro! 🙂 Wish you also a good continuation!
Åsa, yes Portugal appears in our statistics in several different ways, so it is clear that it is popular! 🙂 And certainly other positive and fun things happen in connection with the blog 😉.
Solan, vacuum cleaner test? Haha! Yes, sure, that's what's interesting about statistics! But no, you have to write from the heart and not from what the numbers say 😉.
Ontrip.dk, thank you very much!!!
Geddfish, Lidköping is included in the statistics, but I only listed the 6 cities that we received the most visits from. Here is my life with Peter has done well in the statistics, especially during some months! But when we combine the whole year, it becomes a little different, and then it controls a lot what gets hits via Google.
Åse, I only included the 6 cities that we received the most visits from. Ystad is also included in the statistics, but there are fewer visitors from there simply 😉.
03 January 2017 - 9:36
Jenn - Forever Abroad says:
Fun to get an insight into! I was actually looking at some figures for 2016 vs 2015 and realised that my readers have gone from the majority aged 18-24 to 25-34, they are probably growing with me considering I turn 25 in March 😉.
03 January 2017 - 9:43
nils-åke says:
Ha Ha one of the (2 %) in Helsingborg is me. I think myself that reading the blog will be more and more interesting, there is plenty to choose from.
03 January 2017 - 10:31
Steve says:
Statistics are particularly interesting when, like you, you work commercially with the blog. In this way, you have a good basis when you are going to change / renew and then you can enjoy all the new records you break.
I follow your blog daily and may be part of Örebro's 1% even though I live in Lekeberg. Without a doubt, I am part of that 65+ pile.
I used to have some visitor statistics on my blog, but there was a problem last year and since I couldn't get it sorted out, I dropped the statistics. My loyal and temporary followers are also not more than I can keep them in mind.
03 January 2017 - 10:49
Dryden - Traveler's Edition says:
Yes, I usually check the statistics. The larger statistics where I look deeper at read posts, who everyone is and so on, I do more rarely but I follow general and "superficial" numbers daily. 🙂
03 January 2017 - 11:11
Clara, Bossbloggen says:
High five to you for doing such a good job! I can say that I'm involved in representing Lund anyway, even if I don't fall under your "typical readers"?
03 January 2017 - 11:28
4000mil says:
I agree, statistics are fun! We had about 46,000 unique readers during the year, so we have some way to go to reach your level. ?
Most read are our posts from Sri Lanka, but also our tips on how to afford to travel more and "4 excursions from Umeå".
03 January 2017 - 12:11
Berit "desires' says:
Of course it's great fun to check the statistics! I only invest in what I think is fun - to tip others about different trips I have made, I do not have the energy / interest to devote so much time to my blog desires.se - in the way you do for your professional / business and superb blog!
BUT still had 125,000 unique visitors last year! Which I am very happy about! ??
One.com changed the criteria for the statistics in February 2016, then the number of visitors dropped a lot, then it increased again when I also started posting my posts in "we who like to travel" and "travel bloggers" Many people also find me through my directly linked posts in various travel forums (I have understood from mail etc.)
Since I still have the blog tool in one.com, I can't use google's statistics, they have recently informed me....But one.com says that their current statistics update will be more reliable and clear now!
Happy New Year of Travelling!
03 January 2017 - 12:50
åsa i åsele says:
Interesting statistics, especially when they are positive 🙂 .
I thought that Fridays with Peter/Here is my life would make it to the Top 5 🙂 .
I think the mixture in your blog is what your readers appreciate most, and the fact that you are also personal and offer yourself is a plus.
03 January 2017 - 13:07
Rolle o Carina says:
Your Blog is just so much fun to follow, interesting destinations and posts!
We'll be following you throughout 2017 and beyond.
Good luck.........
03 January 2017 - 13:32
Jeanette says:
Great statistics! You are growing like crazy 🙂
Hehe did not even try to get into the Duomo because the queue there was insanely long.
03 January 2017 - 13:38
Jennifer says:
What fun to see some statistics! I am a so-called recurring reader - have had a break in both reading and writing, but now with a new domain - I'm up and running again and doing it with bravura as I now follow you again 🙂
03 January 2017 - 13:58
BP says:
Apart from the most read post "Food, wine and prices in Portugal" which was slightly unexpected in first place, the statistics do not surprise me. The fact that most readers of your blog are over 45 is quite logical, as this group can afford to buy a motorhome, for example, and want tips and so on. The fact that Croatia comes first is also logical, as the country is becoming more and more attractive for Swedes to travel to.
Most bloggers are women - so no surprise here either.
However, I thought Peter's Friday posts/my life would be in the top 5, as they generate so many long and personal comments.
Your blog is as user-friendly on a computer as it is on an iPhone.
I rarely look at the statistics, as I don't really understand them;-) Also, blogspot doesn't have the same "statistical subtleties" as WordPress.
03 January 2017 - 13:59
Christine - 29° says:
Always fun with statistics. Especially like to see "most read posts" because it is so rarely what you think or think it should be. 🙂
03 January 2017 - 15:13
Berit "desires' says:
Helena!
You thought when we were in contact a few years ago that I should sign up for the blog portal with as many readers as I have.
My answer is that I have been in the Blog Portal for many years BUT in order for me to be visible there, I have to put their "code" on my blog page, so that the statistics are calculated automatically via the Blog Portal.
AND it did NOT work on my blog with one.com's blogging tool, unfortunately! The blog portal tried to help me but it is NOT possible to post such "codes" on my blog - one..com has informed me!!! ??
03 January 2017 - 15:24
Ama de casa says:
Congratulations to all readers and comments! Not at all strange, though, with your nice blog and many tips on travelling and other things 🙂.
I probably end up among the two per cent from Spain and also from the USA. Now that we are spinning around on the sea, I probably won't be noticed so much... 😉.
A blog is always interesting to read when the writer puts his/her heart and soul into it and writes in a committed way. Just like you do. I'm a bit surprised that Peter's "this is your life" post didn't end up higher on the list. But on Fridays there aren't as many visitors. Not on my blog anyway. People are probably busy with their own Friday cosiness 😀.
Have a great rest of the year!
03 January 2017 - 16:28
Anette says:
You have at least one reader in Thailand?
I check some statistics but my blog is so small that the numbers don't tell much.
Keep writing about things you like, I think it's best that way.
03 January 2017 - 17:49
Anki says:
Interesting reading ... but I never check the statistics myself 🙂 ...
Your blog is great and I follow it regularly, even though I'm bad at commenting...
03 January 2017 - 18:42
admin says:
Jenn, your readers probably follow you in age. And maybe that's lucky! Maybe it would have been sad if it only continued to be 18-year-olds while you get older... 😉.
Nils-Åke, nice to have a Helsingborg representative 🙂 .
Steve, I don't know exactly how they count the towns, maybe Lekeberg is included if I scroll far enough in the list 😉 It's a shame that your statistics are complicated. It does not have to be super important with the statistics, but hassle is never nice ...
Dryden, I probably don't check daily, but I do check from time to time. But I agree, usually it is only a "superficial" check.
Clara, thank you! And nice with a Lund representative 🙂 (I also come from Lund from the beginning myself;))
4000 miles, well done! Also sounds like sensible and good posts at the top!
Berit, blogging should be fun and the best way to do it is to write about what you're passionate about! It seems like you're having a lot of trouble with the blog tool at One.com, from having to redo the images to not being able to enter code. Bummer! And bad that they can't help with any of this, adding a small piece of code feels like an important opportunity when you have a blog!!!! Unfortunately, it is difficult to compare statistics between different blogging tools and it is impractical not to have Google Analytics, which is the industry standard. According to One.com's own statistics, we have had 1,848,935 visits in 2016, which seems completely crazy if we compare with what GA says. I don't really know what One.com means by that figure or what they count as "visits", but regardless, it feels strange ...? Among other things, One.com's statistics claim that we had 85,000 visits from California during the year. My guess is that there's a spam robot living there that they haven't managed to filter out... I'm not saying anything about your statistics now, I'm just trying to explain why people usually think that you can't compare between different tools. For this reason, it's really bad of One.com not to make it possible to use Google Analytics! But there is much more than statistics that is important (and fun!) with a blog! Wishing you a great blogging and travelling year! Will there be a trip to Croatia this year, or maybe somewhere else?
Åsa in Åsele, Happy Friday has done really well if you look at the statistics for certain individual months. Spread out over the whole year, they fall a little further down.
Rolle and Carina, glad that you continue to follow! Wishing good continuation!
Jeanette, we hope it wasn't worth seeing it from the inside then! 😉
Jennifer, great to see you here! I will check in with you again!
BP, we don't use statistics at WordPress, we use Google Analytics. Simply because it is the industry standard, and considered the most reliable tool. Peter's Happy Friday has been high up there if you look at the statistics for individual months, but when I broke it out over the whole year it was different.
Christine, right? One is always surprised 😉 .
Ama de casa, yes you can represent both Spain and the USA! 😉 As I wrote to others above, Peter's Happy Friday was quite high in individual months, but not over the whole year. And otherwise it is the same for us. Traffic has always been lowest on Fridays ... (and highest on Sundays).
Anette, nice to have a reader from Thailand! And I agree, when you write about what you like, it's the best!
03 January 2017 - 19:15
Matts Torebring says:
Seeing the statistics and seeing which headlines "sell" is one of the most exciting things about the blog, second only to all the new friends we've made. Very interesting what you share with us. I will never be able to compete with you, as I hinted before, I am still in primary school.
Nor do I want to grow to the heights you have reached. I work far too much and the blog is a lovely way for me to relax in the evening. I also love taking photos, writing and telling stories. I'm only about a third of the way through your speeches in 2016. I'm very happy with that. It's so much fun!
I think your commitment is fantastic! How do you manage to comment on all the posts? I don't get it! It takes time! Only a few people do it! I try never to leave any comment untouched. How do you catch everything that happens? You are amazing!
It's also fun to see how long a post lives. I had a post that was at the top of the list for three years in a row. "Our Finnish comrades". This is also fun, that a post doesn't just live for the moment. Ulricehamn municipality contacted me this week to ask if they could quote a post I made three or four years ago on my blog. Surely we have fun we "Motorhome addicts".
03 January 2017 - 19:15
Stare Ström says:
What a fun read! I haven't looked that closely, but it's fun to see how many people are watching and from which countries.
Good luck!
03 January 2017 - 19:47
Emma, Sol som sol? says:
I have not read all the comments but I am one of the 2%s in Spain. I the one and Ama the other? 🙂 No, a few more of us are probably all.
What I was thinking about what does and does not work (or is read in this case) may also have to do with the time of year you write the post itself, if it coincides with the fact that people are thinking about a trip out into the world.
And there's no getting away from it, it's fun to see the statistics! How many people visit the site and, like you, how many people return (I have 68%, which I think is a great confirmation that I am so happy about!)
Happy new year! Now I'll read on, I'm behind in my blog reading because I've been slaving away in the kitchen for almost two weeks, it feels like!
03 January 2017 - 20:11
Berit "desires' says:
Thank you for taking the time to respond to all the comments!
Yes, it's strange with the blog statistics in different ways... The last time you and I had that discussion, you also mentioned Helena that one.com's statistics showed extremely and totally unreasonable high numbers.
visitor figures for YOUR blog (in our contact you checked again, then you came back to me and said you had looked completely wrong, you said something about what you had read as visitor statistics/day was for several months... )
I am not saying that you are now again
read your statistics on one.com. . in the wrong way, but I must admit that the figures you mention (over 1 million readers) according to them, sound completely unreasonable. So for your blog in particular, it seems to be completely wrong! ... Whatever the reason.
Keep up the good work with your blog!
03 January 2017 - 20:34
Eva - People in the Street says:
Interesting! My most read week after week is Blue Door from Notting Hill. I didn't see that one coming ...
03 January 2017 - 21:33
admin says:
Matts, all the new friends you have made through the blog is really one of the great things!!! I understand your idea of not wanting the blog to be TOO big, it takes time! Still, it's nice that you are doing so well for you both in terms of visitors and inquiries on the blog. If you write continuously and with quality, Google notices it and people find it. So it is with your blog too!
Stare Ström, it's not so often we check like that either, but now it was fun to make a kind of "year-end report" 😉.
Emma, great to have another visit from Spain! Yes, I think that behind the Spain statistics there is also a bunch of motorhome travellers 😉 And of course the time of year matters! For example, we usually have more visitors in the spring, because that's when people google about motorhome travel and destinations in Europe. Wishing you a happy new year!
Berit, yes, I remember we talked about this before! I don't really remember what we came up with, but maybe you had access to more "advanced" statistics at One.com because you use their blog tool? I only have them as a web host, so maybe you get fewer statistics functions? I don't really understand how I could have misread it, but I'll see if I can take a picture of it. As I said, it feels like we have discussed this before, haha. Have fun!
Eva, sometimes you don't see it coming 😉.
03 January 2017 - 21:54
Susjos says:
Exciting with statistics, must check out my blog's statistics!
Happy New Year!!!
03 January 2017 - 23:46
admin says:
Susjos, yes you can be surprised sometimes when you look at the statistics 😉 Wishing you good continuation!
04 January 2017 - 6:38
Annalena says:
Yes, I belong to the categories woman, 35-44, somewhere in Sweden and returning 🙂 .
When I started reading your blog a few years ago, I ended up here because I googled motorhome and Poland and then I was hooked. I backed up and read EVERYTHING! So I have read every single one of your posts 😀 In addition, you answered Helena to some questions about Poland then... <3
I have 3 things I do every day at home at the computer on the kitchen table: check your blog, check Fredrik Backman's blog (which is not updated so often) and check Hemnet 🙂 If I miss a day, I go back and read up... However, I do not comment so often, but I am here! 😀
What keeps me coming back is that 99 % of your posts are interesting to me/us. Nice pictures, good layout and above all well written!
I often find myself in conversations with family and friends that I start with: You know that campervan blog I read... 😀 😛.
I hope you continue as long as you enjoy it and that I get to join you on your adventures!
Many New Year wishes to you from me and my family here in North Hawaii. Hugs to you
04 January 2017 - 17:59
admin says:
Annalena, but wow, we were incredibly touched and happy about your comment (which I just read aloud to Peter!)! I really do not know what to say, but thank you very much for telling us, so incredibly fun to hear that you appreciate what we write! Warm hugs and wish you and your family a very happy new year 2017!
04 January 2017 - 20:48
Mycket annat och lite betong says:
Haha, I'm one of those regular visitors.
We're pretty new to this whole campervan thing. I would like to read about little tips on clever things in the motorhome. For example, how to prevent coffee cups from falling out every time you open the cupboard door.
Good luck!
Agneta
04 January 2017 - 20:55
admin says:
Agneta, great, great suggestions! We will definitely write about that when it gets closer to spring (and when we get our motorhome home)!
05 January 2017 - 7:13
Marias Memoarer says:
Fun with statistics! 🙂 I think you should continue exactly on this path, you have a rather unique niche but which you alternate with a little more general travelling. I myself am not so interested in that kind of camping, which is why I appreciate other travel posts and other personal things extra much with me 🙂 Hope you get another really successful blog!
05 January 2017 - 8:08